Understanding the numerical of Physics with the help of equations and derivations can be uninteresting, but with the help of graphs, it becomes interesting as well as easy to understand what the solution is explaining. Graphs in Physics play a vital role as most of the concepts use them.

What is Graph?
Graph is defined as a pictorial representation of information which is a two-dimensional drawing explaining the relationship between dependent and independent variables. Independent variables are represented on the horizontal line known as x-axis while the dependent variables are represented on the vertical line known as y-axis.
We have already seen mathematical approach towards speed, velocity, distance and displacement. But graphs actually give us a better understanding of the motion. From the point of view of physics one should be able to interpret motion by looking at graphs. Here we will be talking mainly about velocity time graph and displacement time graph.

Displacement Time Graph
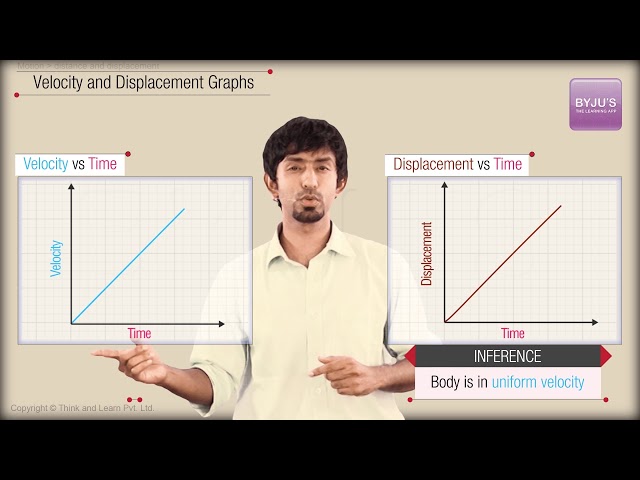
Displacement of an object is defined as how far the object is from its initial point. In displacement time graph, displacement is dependent variable and is represented on the y-axis while time is the independent variable and is represented on the x-axis and is also known as position time graph. There are three different plots fro displacement time graph and they are given below:
- First graph explains that the object is stationary for a period of time such that the slope is zero which means that the velocity of the object is zero.
- Second graph explains that the velocity of the object is constant and increases with time such that the slope of the graph remains constant and positive.
- Third graph explains that the acceleration, velocity and displacement are constant. The slope of the graph increases with time.
The slope for displacement time graph is given in the table below:
\(\begin{array}{l}\frac{\Delta d}{\Delta t}\end{array} \) |
Therefore, following are the takeaway from the displacement time graph:
- Slope is equal to velocity.
- Constant velocity is explained by the straight line while acceleration is explained by the curved lines.
- Positive slope means the motion is in the positive direction.
- Negative slope means the motion is in the negative direction.
- Zero slope means that the object is at rest.

Related Articles
Velocity Time Graph
In velocity time graph, velocity is the dependent variable and is represented to the y-axis and time is the independent variable, represented on x-axis. The slope of the velocity time graph is given as in the table:
\(\begin{array}{l}\frac{\Delta v}{\Delta t}\end{array} \) |
We see that slope of velocity time graph is the definition of acceleration, therefore it can be said that slope is equal to the acceleration. Therefore, following are the points understood from the slope:
- Steep slope represents the rapid change in velocity.
- Shallow slope represents the slow change in velocity.
- If the slope is negative, then the acceleration will also be negative.
- If the slope is positive, then the acceleration will also be positive.
- The area under the velocity, represents the displacement of the object.

Acceleration Time Graph
In acceleration time graph, acceleration is the dependent variable and is represented by the y-axis and time is the independent variable and is represented by the x-axis. The slope of acceleration time graph is as given in the table:
\(\begin{array}{l}\frac{\Delta a}{\Delta t}\end{array} \) |
The slope of the acceleration time graph is known as jerk. Following are the points understood from the graph:
- If slope is zero, then the motion is said to have constant acceleration.
- The area under the graph represents the change in velocity.


Comments